Module 4 : Part I - Understanding the Relationship Between Two Categorical Variables - PivotTables
The material presented in Module 4 will allow us to investigate, measure, and test relationships between two (or more) categorical variables. The variables under investigation are referenced using the following terms.
| Definition |
|
Response Variable : The primary outcome or variable of interest in an investigation. Predictor Variable : The other variable(s) being considered in an investigation that potentially influence the resposne variable |
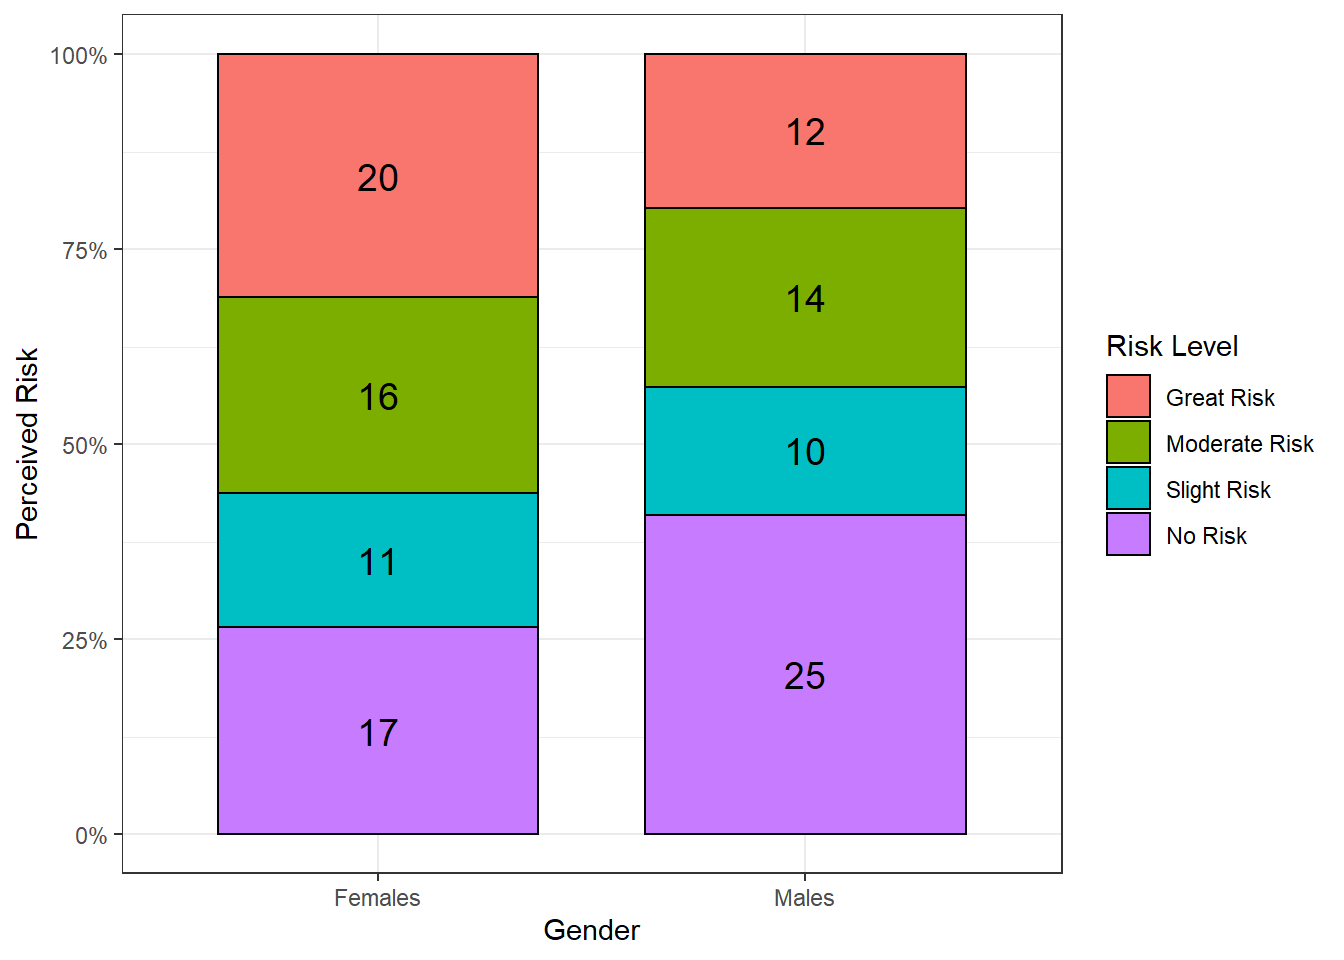
Consider once again the data presented in Module 3 regarding the perceived risks of smoking marjiuana for Female and Male students in Grade 11 from Fillmore County. The two variables in this investigation are identifed as follows.
The response variable for this investigation is Perceived Risk
The predictor variable for this investigation is Gender
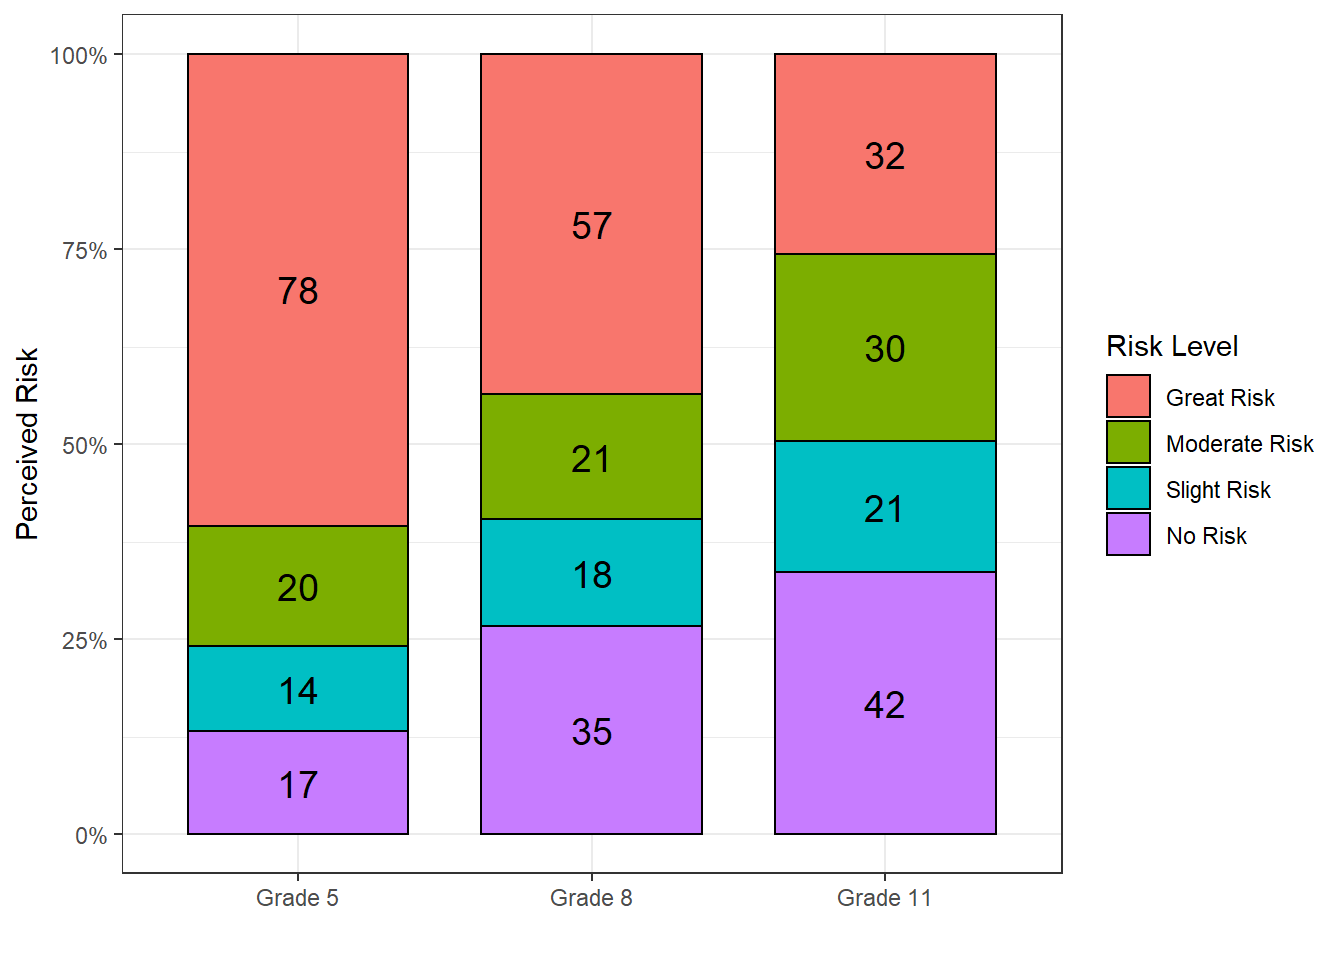
If the goal of an investigation is to compare the perceived risk of smoking marjiuana across grade levels, then the associated segmented bar graph would have the following appearance and the two variables would be identifed as follows.
The response variable would be Perceived Risk
The predictor variable would be Grade
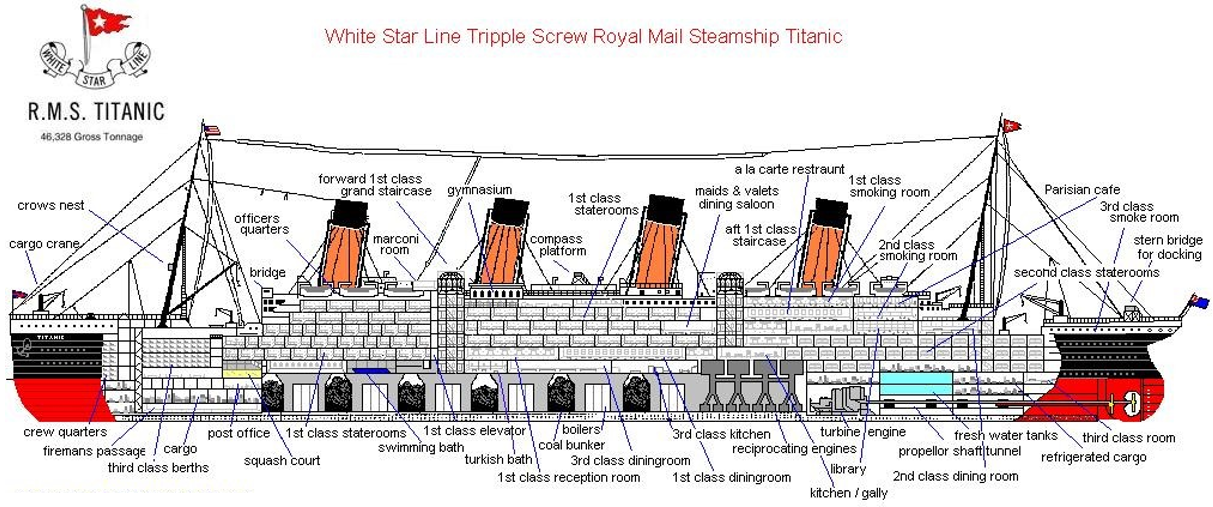
Example 4.1.1: Consider the following snip-it of data from the Titanic - the well documented ship that sunk in 1912 on it’s maiden voyage from Europe to the United States.
Data Download: Link
An image of the R.M.S Titatic is provided here. The image shows the various areas for 1st Class, 2nd Class, and 3rd Class passengers. Like modern day flights, 1st class tickets cost more, but 1st class passengers get better accomodations than others.
Consider the following questions that could be considered with the data provided.
- What proportion of the passengers survived?
- What proportion of the passengers purchased 1st class tickets?
These questions require consideration of a single variable from the dataset (Survied for the 1st question and Passenger Class for the second question). On the other hand, the following questions would require consideration of two variables – survival rate and passenger class – simultaneously.
- What proportions of the 1st class passengers survied?
- Does the survival rate of passengers on the Titantic differ by passenger class?
Understanding Relationships with Pivot Tables
A common spreadsheet feature that allows on to quickly summarize data is called a PivotTable.

PivotTables are one of the most under-utilized tools in spreadsheets. PivotTables are a powerful tool and allow one to easily and quickly summarize the data is various ways which is important when trying to understand the relationship between variables.
Let us begin by considering the relationship between Survived and Passenger Class for the passengers from which data has been collected.
The response variable: Survived
The predictor variable: Passenger Class
Type of Summary: Count
Creating a PivotTable
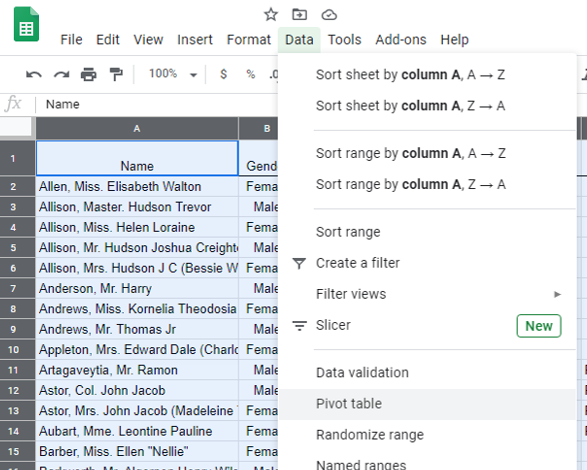
The process for creating a PivotTable in Google Sheets is similar to Excel. In Google Sheets, first highlight the data that you want to summarize, next select Data > Pivot table… [In Excel, highlight the data you’d like to summarize, then select Insert > PivotTable.]
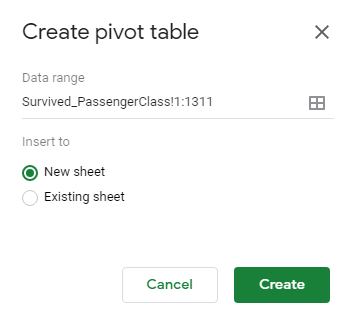
The PivotTable will ask you where you’d the like the output to be placed – typically the output is placed onto a New Sheet. Click Create.
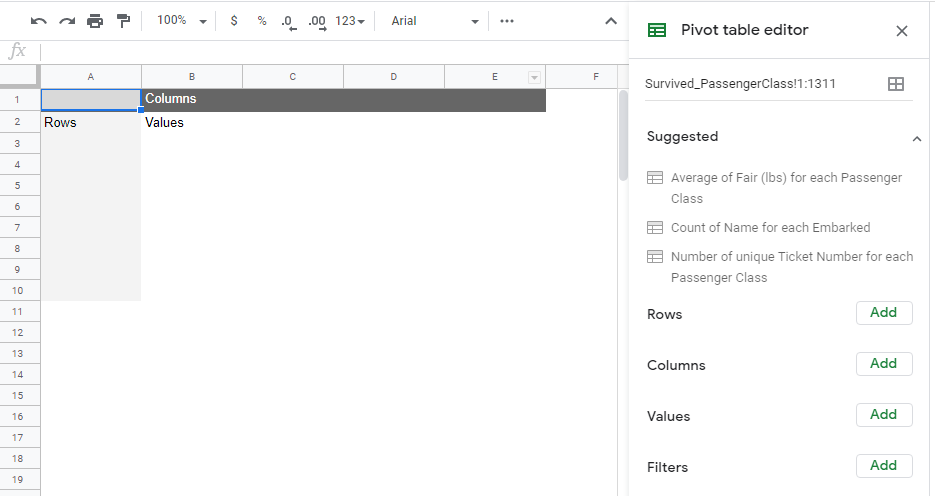
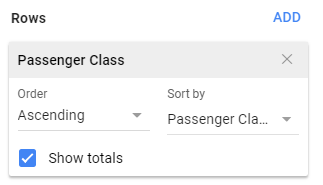
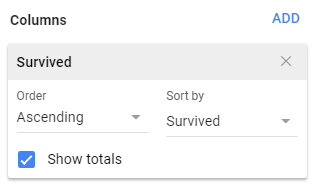
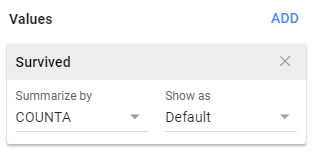
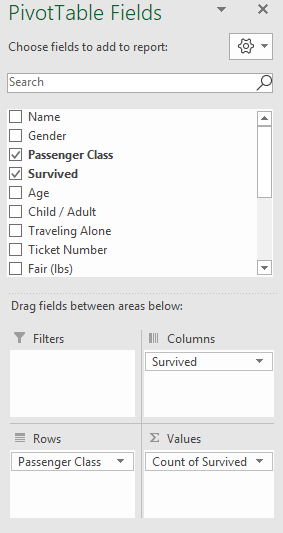
The construction of a PivotTable requires the specification of a Row Variable(s), a Column Variable(s), and a Value(s) Variable. These variables are indicated in Google Sheets under the Pivot table editor box.
The specification for the PivotTable in Google Sheets and Excel is provided here.
|
|
|||||||||||
The following PivotTable is created when using the above specifications. The count for each survived / passenger class combination is provided in this table. The rows of this table contain the levels for Passenger Class (i.e. 1st Class, 2nd Class, and 3rd Class) and the columns contain the levels for Survived (i.e. No, and Yes).
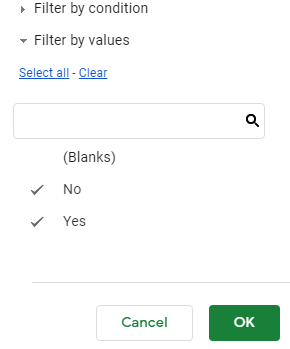
The spreadsheet automatically counts the blank cells - even when there are none. You can remove the blank rows from the table by adding a filter to your PivotTable. A filter simply identifies which rows to display in your table.
| Under Filter, select Survived | Deselect (Blanks) to remove the blank row from the table, Click OK |

|
|
The PivotTable for Survived / Passenger Class with the blanks removed from the table.
Some statisticians refer to this table as a contingency table or cross-tab table – short for cross-tabular table. A contingency table provides counts across the levels of two categorical variables. This table is referred to as a 3x2 table because the row variable (i.e. Passenger Class) has 3 levels and the column variable (i.e. Survived) has 2 levels.
|
Passenger Class |
Survived | Total | |
| No | Yes | ||
| 1st Class | 123 | 200 | 323 |
| 2nd Class | 158 | 119 | 277 |
| 3rd Class | 528 | 181 | 709 |
| Total | 809 | 500 | 1309 |
Questions
Consider the following questions that can be answered using the PivotTable.
How many 1st Class Passengers were there in this data?
Answer: There were a total of \(323\) 1st Class passengers. [Use the row total for 1st Class]How many 3rd Class Passengers were there in this data?
Answer: There were a total of \(709\) 3rd Class passengers. [Use the row total for 3rd Class]How many passengers survived?
Answer: There were a total of \(500\) passengers in this data who survived. [Use the column total for Survived = Yes]Your friend makes the following statement, “More 3rd class passengers survived than 2nd class passengers (181 vs. 119).” This statement is technically true, but why is this statement misleading? Explain.
Answer: This statement is misleading because there were many more 3rd Class passengers than 1st Class passengers in this data.
Comment: When making comparisions across groups, the comparisons must take into consideration that the groups may be of different sizes. The most common approach to alleviate this concern is to compute row percentages and make comparisons using these values.
Questions
Consider only the 3rd Class passengers. How many 3rd Class passengers survived?
Answer: There were a total of \(181\) 3rd Class passengers that survived. [Use the count for the 3rd Class row and the Yes column]What proportion of the 3rd Class passengers survived?
Answer:
\[ \frac{181}{709} \approx 0.255 = 25.5\% \]
- Next, consider the 2nd Class passengers. What proportion of the 2nd Class passengers survived?
Answer:
\[ \frac{119}{277} \approx 0.430 = 43.0\% \]
- Compare the proportion of 3rd Class passengers that survived to the 2nd Class passengers that survived?
Answer: The proportion of 3rd Class passengers that survived is about 25.5% which is considerable lower than the proportion of 2nd Class passengers that survived which was about 43.%.
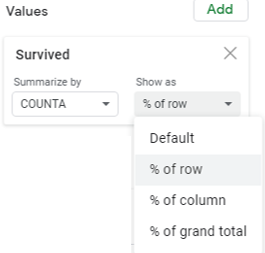
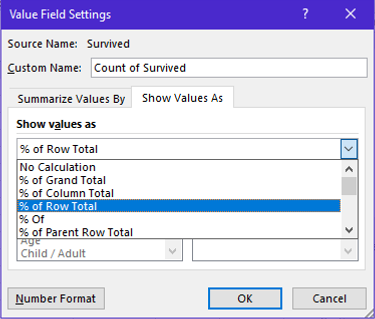
Getting Row Percentages in a Spreadsheet
The following can be done in a spreadsheet to obtain the row percentages in a PivotTable.
| Google Sheets | Excel |
|
|
|
|
The resulting PivotTable that contains the row percentages (instead of the actual counts).
Answer the following questions using resulting tables for this investigation.
| Counts | Row Percentages | ||||||||||||||||||||||||||||||||||||
|
|
||||||||||||||||||||||||||||||||||||
Questions
1. Explain how the value of \(61.9\%\) was computed in the table of percentages. That is, what values were used to obtain this percentage?2. In this example, the percentages in the first row add up to 100%. Will this always be the case when row percentages are computed?
3. Is it true that the 1st Class passengers were most likely to have survived (when compared against 2nd and 3rd Class passengers)? Discuss.
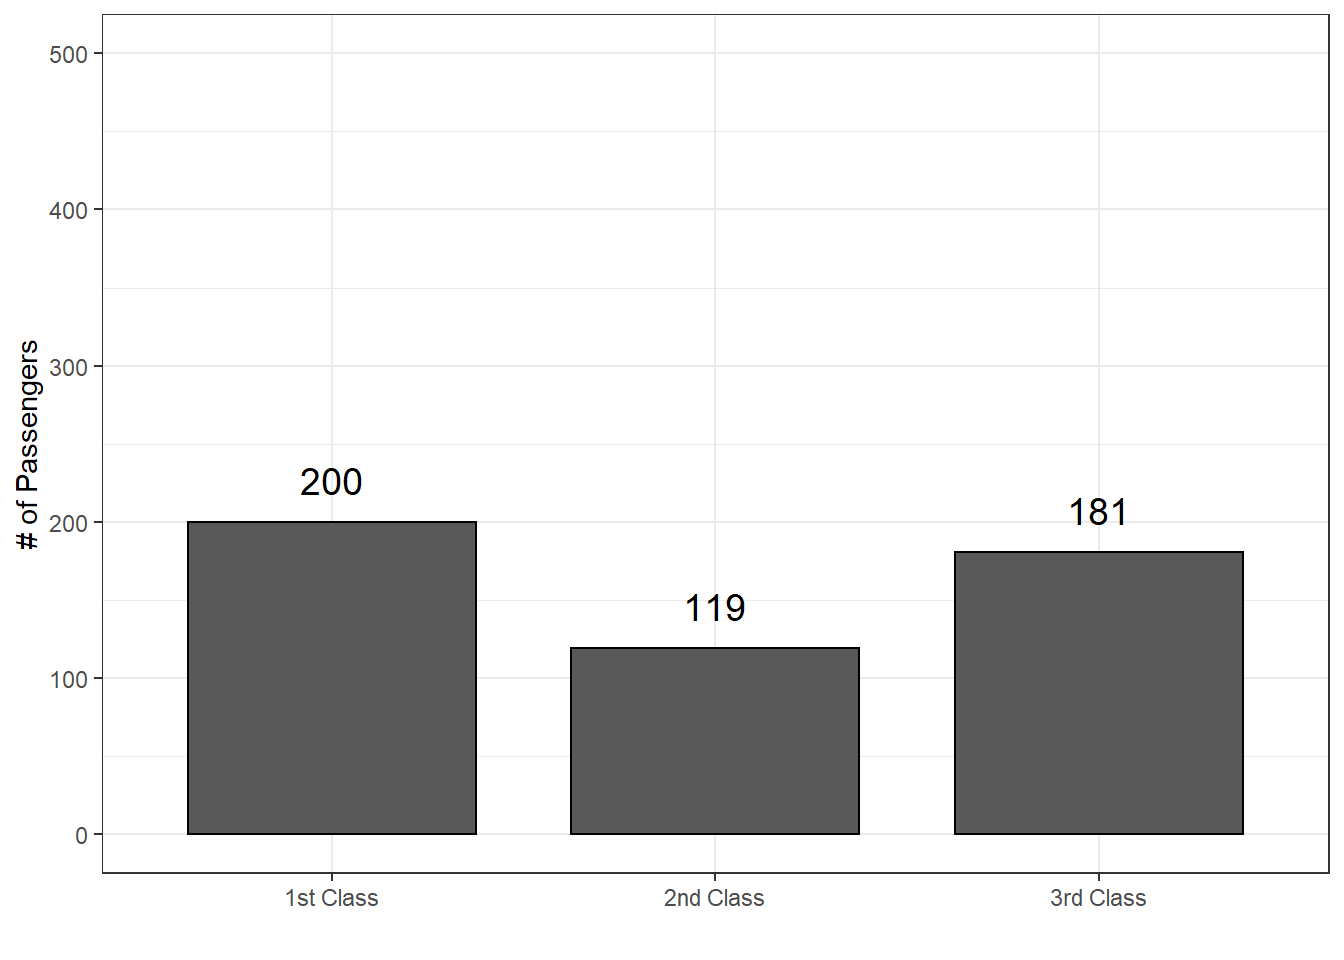
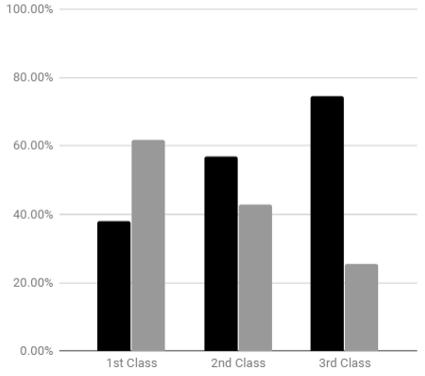
Row percentages should be used when making comparisons across the groups. The following graph shows the survivial rate for each passenger class. The percentages for Survived = Yes are shown in the following bar chart.
Questions
4. The bar for 1st Class appears to be a little over 60%. What is the exact height of the bar for 1st Class passengers?5. What pattern(s) do you see in this plot? Discuss.
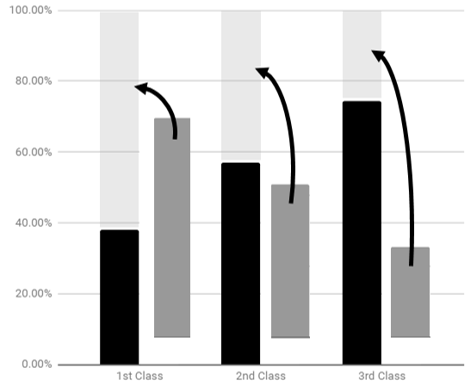
Typically all the row percentages are included when constructing a bar chart – not just the row percentages for Survived = Yes.
| Over time, several people (e.g. Eward Tufte, William Cleveland, Micheal Friendly) have studied how best to display data. Micheal Friendly had devoted much of his work to displaying relationships for categorical data. His webpage is located at http://www.datavis.ca/. |

|
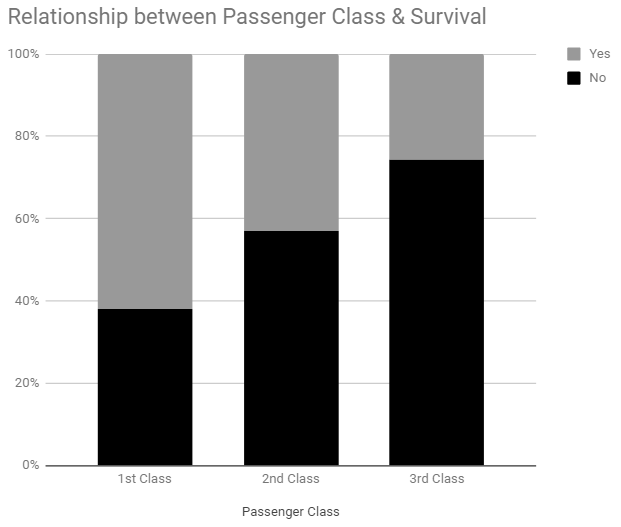
One suggestion to improving our understanding of the relationship between passenger class and survival is to stack the bars for each passenger class instead of using the side-by-side bar chart.
| Side-by-Side Version | Stacked Version |
|
|
In Google Sheets, the type of chart can be changed under Chart Editor.
|
100% Stacked Column Chart 
|
|
The stacked version of the bar chart is commonly referred to as a 100% Stacked Column Chart in spreadsheets. Statisticians may refer to this type of chart as a mosiac plot. The percentages for each segment can easily be added in a spreadsheet by adding Data Labels to bar chart.
Questions
7. The gray box tends to get smaller when moving from 1st Class, to 2nd Class, to 3rd Class. What does this imply about the relationship between Survival Rate and Passenger Class? Discuss.