Module 2 - Part 3: Smell Test for Parkinson’s Disease
Many diseases or other medical conditions have an adverse effect on our senses. In some cases, the sense being affected may be obvious, e.g. eye disease may limit sight or an ear condition may cause deafness. In other situations, the sense being affected may not be as obvious. For example, research has shown that the sense of smell is reduced in individuals with Parkinson’s Disease and Alzheimer’s Disease. Additional research has suggested that the ability to smell is reduced in those that have suffered from Post Tramatic Stress Disorder and those with Schizophrenia.
The most widely used smell test is the University of Pennsylvania Smell Identification Test (UPSIT). UPSIT was developed and validated by Richard L. Doty, Ph.D. who is the director of the University of Pennsylvania Smell and Taste Center. Doty is a world-renowned researcher in the field of olfactory functioning and dysfunction (anosmia). The UPSIT is considerd the gold standard of smell identification tests. [Wiki Link]
The following video shows the use of the UPSIT in the United States Military to detect head trama, chemical exposure, and Post Tramatic Stress Disorder (PTSD).
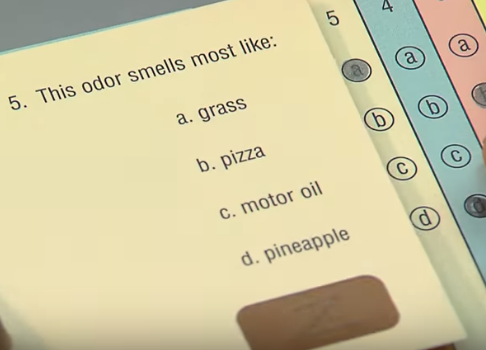
Example 2.3.1: Doty (2012) discusses the use of the 40-item University of Pennsylvania Smell Identification Test (UPSIT) as an early and sensitive marker of the preclinical phase of Parkinson’s disease. Morley, et al. (2018) discussed the optimization of UPSIT for patients with Parkinson’s disease. The UPSIT contains a total of 40 item, i.e. trials. For each trial, an individual must scratch-and-sniff the odor and then choose one of four options for the odor. An example item is shown here.

Morley (2018) provides information regarding typical scores for UPSIT in two different populations. Morley (2018) reports that the average score on the 40-item UPSIT from patients with Parkinson’s Disease is \(19\). The average score from a matched-contol group (i.e. matched according to age, sex, smoking status, etc) is \(28\).
Sources:
Doty, R. L. (2012) “Olfactory dysfunction in Parkinson disease”. Nat. Rev. Neurol. 8, pp. 329–339.
Morley, James, et al. (2018). “Optimizing olfactory testing for the diagnosis of Parkinson’s disease: item analysis of the university of Pennsylvania smell identification test”. Nature:NPJ Parkinson’s Disease, Volume 4, Article number: 2. [Link]
Suppose a patient, generically identified as Patient A, is believed to be in the preclinical phase of Parkinson’s disease. Patient A is given the 40-UPSIT test and suppose their score is a \(19\). Consider the following research questions.
Research Question #1: Does Patient A perform better than an individual with complete olfactory dysfunction (i.e. no ability to smell)?
Research Question #2: Does Patient A suffer from some level of olfactory dysfunction relative to a control group (which is known not to have Parkinson’s disease)?
Use a formal statistical test to answer each of these research questions.
Analysis for Research Question #1
Consider the following information regarding the setup of the reference distribution for Research Question #1.| Necessary Information for Reference Distribution | Values |
| Number of trials | 40 |
|
The likelihood or chance of a corrrect response (under the situation of no ability to smell) |
1 out of 4; i.e. \(\frac{1}{4}\) |
A schematic showing the appropriate reference distribution for Research Question #1.

| Analysis for Research Question #1 | |
| Research Question #1 | Does Patient A perform better than an individual with complete olfactory dysfunction? |
| Testable Hypothesis | \[ \begin{array}{l} H_{O}: \text{Patient A has no ability to smell; that is, probability of correct is 25%} \\ H_{A}: \text{Patient A has some ability to smell; that is, probabilty of correct is greater than 25%} \\ \end{array} \] |
| Parameter | \(\pi = \text{the probability of correctly identifing the odor}\) |
| Rewrite of Hypothesis | \[ \begin{array}{l} H_{O}: \pi = 25\% \\ H_{A}: \pi > 25\% \\ \end{array} \] |
| Type of Test | Right-tailed |
| Observed Outcome | Patient A was able to correctly identify the odor in 19 trials |
Question
Use the Simulation App to obtain a reference distribution. Use several thousand repeated outcomes when obtaining this distribution. Obtain the p-value using your reference distribution.
- Complete the following to embed a screen-shot of your reference distribution into your notes:
- Click to open Simulation App -- the app will appear in a new tab on your browser: Link
- Create the appropriate reference distribution and obtain a screenshot. You may save a local copy of this screenshot to your computer.
- Drag & Drop the image into the dotted box below, or click Choose Fileto load the file
- Click Upload Image to Course Database to save the image into the course database
The following window will be used upload a screen-shot of your work.
Remove this screenshot and submit another
Questions
- Using your reference distribution, obtain the p-value, provide a statistical decision for your test, and write a conclusion that can be understood by a non-statistician.
| P-Value |
2a. What is the p-value? |
|
Statistical Descision |
Decision Rule: If p-value < 0.05; then have enough statistical evidence for the research question.
|
| Conclusion |
2c. What is your conclusion? Write this so that a non-statistician can understand the findings from your investigation. |
Analysis for Research Question #2
Next, consider the following information regarding the setup of the reference distribution for Research Question #2.
Research Question #2: Does Patient A suffer from some level of olfactory dysfunction relative to their control group (which is known not to have Parkinson’s disease)?
| Necessary Information for Reference Distribution | Values |
| Number of trials | 40 |
|
The likelihood or chance of a corrrect response (under the situation of being similar to their control group) |
\(\frac{28}{40} = 70\%\) |

| Analysis for Research Question #2 | |
| Research Question #2 | Does Patient A suffer from some level of olfactory dysfunction relative to their control group |
| Testable Hypothesis | \[ \begin{array}{l} H_{O}: \text{Individual has same ability to smell as the control group} \\ H_{A}: \text{Individual has reduced ability to smell relative to the control group} \\ \end{array} \] |
| Parameter | \(\pi = \text{the probability of correctly identifing the odor}\) |
| Rewrite of Hypothesis | \[ \begin{array}{l} H_{O}: \pi = 70\% \\ H_{A}: \pi < 70\% \\ \end{array} \] |
| Type of Test | Left-tailed |
| Observed Outcome | Patient A was able to correctly identify the odor in 19 trials |
Question
Use the Reference Distribution App to obtain a simulated reference distribution. Again, use several thousand repeated outcomes when obtaining this distribution. Obtain the p-value using your reference distribution.
The following window will be used upload a screen-shot of your work.
Remove this screenshot and submit another
Questions
- Using your reference distribution, obtain the p-value, provide a statistical decision for your test, and write a conclusion that can be understood by a non-statistician.
| P-Value |
4a. What is the p-value? |
|
Statistical Descision |
Decision Rule: If p-value < 0.05; then have enough statistical evidence for the research question.
|
| Conclusion |
4c. What is your conclusion? Write this so that a non-statistician can understand the findings from your investigation. |
Consider your conclusions from the two research questions when answering these questions.
Questions
6. Your friend makes the following statement, "Patient A likely does not have Parkinson's disease because they have the ability to smell as shown by Research Question #1." Do you agree or disagree with your friends statement. Briefly discuss.
7. Suppose the p-value for Research Question #2 was 0.37; that is, suppose the outcome from the study was in the bottom 37% of reference distribution. Does this change the prognosis that this individual may have Parkinson's disease? Briefly discuss.
Example 2.3.2
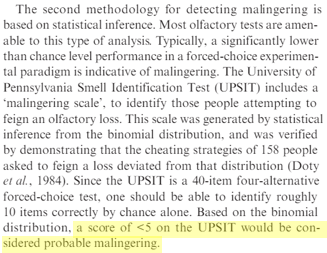
Kurtz, et al (1999) discusses the ‘malingering scale’ of UPSIT. The ‘malingering scale’ is used to identify those people who are attempting to feign an olfactory loss (i.e. lie about their ability to smell). The following statment is made in their article.

Statement of Interest: “…, a score of < 5 would be considered probably malingering”.
Source: Kurtz, D., White, T., Hornung, D., Belknap, E. (1999). “What a Tangled Web We Weave: Discriminating between Malingering and Anosmia”.Chemical Senses, Volume 24, Issue 6, December 1999, Pages 697–700. [Link]
Use the Reference Distribution App with a specification of \(Sample \space Size (n) = 40, \pi = 25\%\), and \(\text{Number of repeated outcomes} = 5000\) to obtain a simulated reference distribution. Use this distribution to determine how likely it is that a person with no ability to smell would be identified as malingering. In this situation, UPSIT would falsely accuse someone of lying about their inability to smell, when in fact they are telling the truth. That is,
compute the probability of getting four or less using a reference distribution. The mathematical representation of this probability is as follows. \[
P(Outcome \le 4)
\]
The following window will be used upload a screen-shot of your work.
Remove this screenshot and submit another
Question
8. What is the probability of getting an outcome of four or less in this reference distribution?
9. Do you feel this probability is low enough to ensure that people who cannot smell would rarely be accused of lying? Briefly discuss.